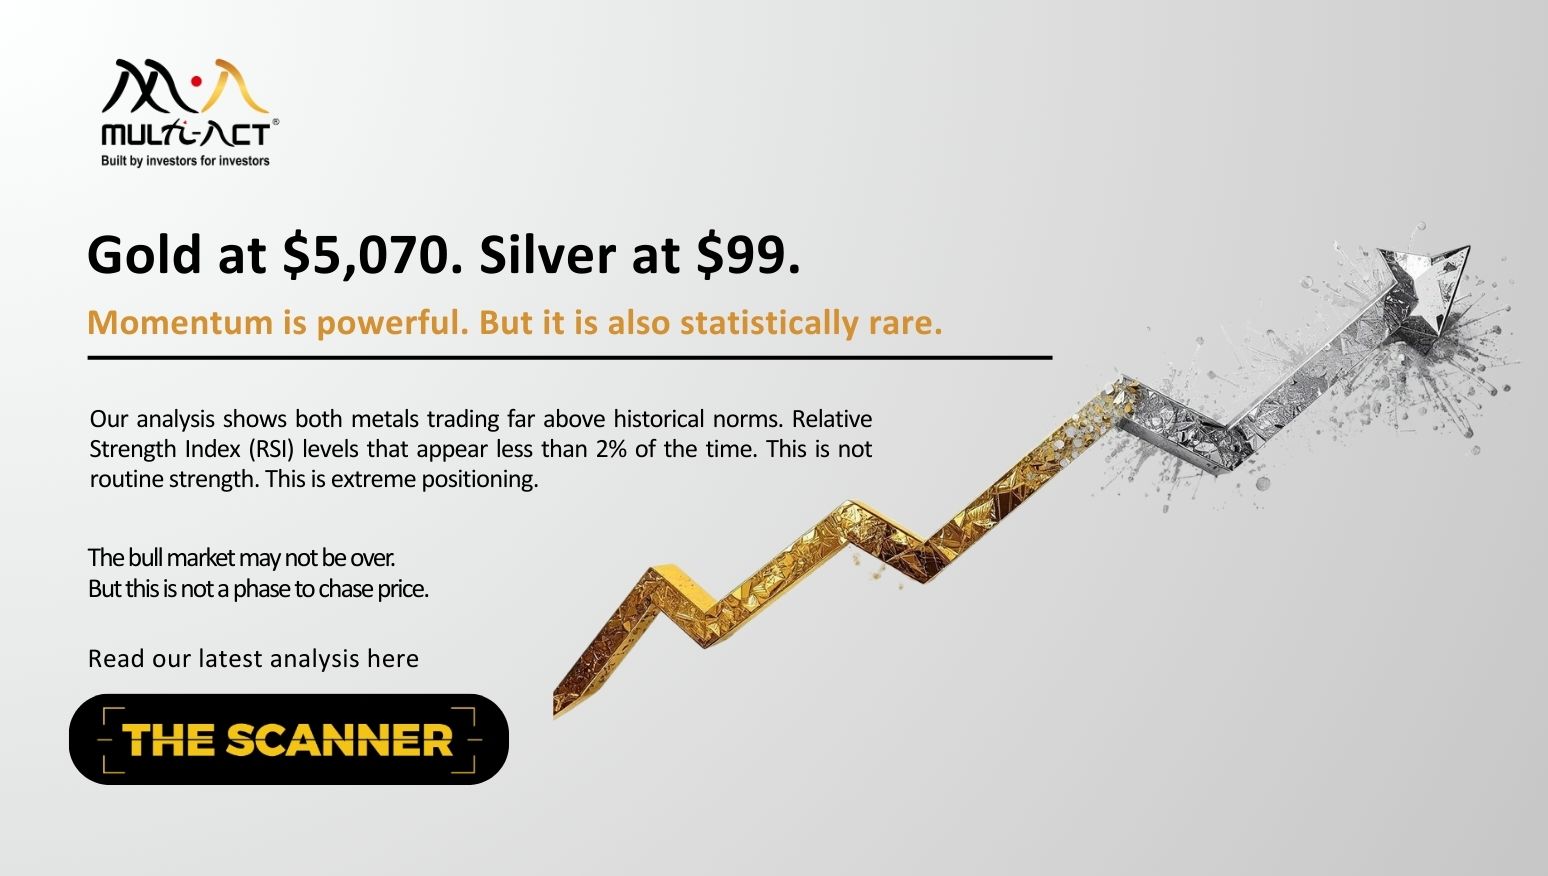
The Scanner, Jan’26 | Gold and Silver : Opportunity or overheating?
When prices rise very quickly, they often pause, or correct. In such moments, slowing down and staying … Continued
Read more29 November 2019

This is a follow up on our study in Sep-19 on Systematic Investment Plans (SIPs) and odds of making “equity-like” returns. (Recommend you to read here before proceeding)
Using Nifty Total Return Index, we had shown that odds of making 14% CAGR is as good as flipping a coin.
The study also showed that one can improve the odds of making “reasonable returns” by expecting 12% or less returns and by investing for at least 4 – 5 years using SIP.
We also left with a question if it is worth investing in equity funds via SIPs given the odds of making required returns and inherent risks involved with equity investing (not to forget expense ratios, taxes, performance consistency, etc.).
In Part 2, we have brought in valuation angle.
We have used Nifty Total Return Index (TRI) quotes since July-1999 for our study. Our sample size thus consists of 124 periods of “10-year SIPs”. Latest 10 year period was Oct-2009 till Oct-2019.
Below is IRR/CAGR of each of those 124 10-Year SIPs.

How much role does valuations, during 10 years SIP, play?

In the above chart, one can see that probability of making 14% decreases as time spent by Nifty above its long term average of 19.8x increases during 10-year SIP period.
Simply speaking, if you are investing in Nifty each month, then chances of you making 14% required return decreases if you have invested in say 60-70 months or more when Nifty P/E exceeded 19.8x.
(Though we believe Nifty P/E may not be most appropriate tool for valuations. Read appendix below.)
Conclusions:
1. Valuation during the period does play an important role when it comes to making equity-like returns through SIP investing.
2. On risk-adjusted basis, results can be much better if SIPs are avoided when Nifty P/E is above long term average of 19.8x, especially when it is near +1 standard deviation of ~24x.

3. One may continue with SIP when Nifty valuation is above average, but with lower returns expectations. (However, as was discussed in Part 1, one should assess if lower returns adequately compensate risks assumed).
4. At least avoid starting SIPs when Nifty P/E is significantly above average and may be even avoid ending at a time of severe correction when P/E has contracted significantly!!
Krushi Parekh
Sr. Research Analyst
Nov-2019
Above conclusions are for academic purposes. None of it should be construed as investment recommendation or advice. Please consult your investment advisor before taking any decisions.
Appendix: Multi-Act P/FV vs Nifty P/E
We believe Nifty P/E is not the most appropriate tool to measure Nifty valuation since it is dependent upon “reported earnings” and all companies are painted with same brush.
We would have ideally preferred to use our own proprietary “Estimated Business Value” (EBV) range framework on Nifty for this study. With this framework, we value companies suitably, according to their underlying businesses, and not just P/E.
EBVs on individual Nifty constituents are then used to arrive at overall Nifty valuation range each month as shown below. Fair value (FV) is mid-point of high and low points of the range as represented by dotted lines below.

For your reference, we have also converted our Nifty Price/Fair Value (P/FV) to “Multi-Act (equivalent) Nifty P/FV” and made it comparable with Nifty P/E in below chart.

You can see that currently Nifty P/E appears to be at +2SD. However, Multi-Act Nifty P/FV equivalent is suggesting “not very expensive” Nifty.
Considering lack of history with Multi-Act Nifty P/FV, we have used reported P/E in the above SIP study.
Multi-Act publishes Nifty P/FV and many such other market indicators in its monthly report for its clients that help them take allocation and portfolio risk calls.
You can access a sample report here. To know more about such reports, click here.

When prices rise very quickly, they often pause, or correct. In such moments, slowing down and staying … Continued
Read more
2025 did not challenge growth. It challenged assumptions. As expectations moved ahead of actual delivery, prices adjusted … Continued
Read more
Macro numbers alone rarely tell the full story. When jobs, consumption, credit, and inflation are considered together, … Continued
Read moreReceive monthly updates by signing up to our newsletter.
| Sr. No. | Received from | Pending at the end of last month | Received | Resolved* | Total Pending # | Pending complaints > 3 months | Average Resolution time^ (in days) |
|---|---|---|---|---|---|---|---|
| 1 | Directly from Investors | 0 | 0 | 0 | 0 | 0 | 0 |
| 2 | SEBI (SCORES) | 0 | 0 | 0 | 0 | 0 | 0 |
| 3 | Other Sources (if any) | 0 | 0 | 0 | 0 | 0 | 0 |
| Grand Total | 0 | 0 | 0 | 0 | 0 | 0 | |
Number of complaints received during month against the IA due to impersonation by some other entity: Nil
Note: In case of any complaints received against the IA due to impersonation of the IA by some other entity, the IA may adjust the number of such complaints from total number of received/resolved complaints while preparing the above table. Further, IA must close such impersonation related complaints after following the due process as specified by SEBI/ IAASB.
* Inclusive of complaints of previous months resolved in the current month.
# Inclusive of complaints pending as on the last day of the month.
^ Average Resolution time is the sum total of time taken to resolve each complaint in days, in the current month divided by total number of complaints resolved in the current month.
| Sr. No. | Month | Carried forward from previous month | Received | Resolved* | Pending# |
|---|---|---|---|---|---|
| 1 | April, 2025 | 0 | 0 | 0 | 0 |
| 2 | May, 2025 | 0 | 0 | 0 | 0 |
| 3 | June, 2025 | 0 | 0 | 0 | 0 |
| 4 | July, 2025 | 0 | 0 | 0 | 0 |
| 5 | August, 2025 | 0 | 0 | 0 | 0 |
| 6 | September, 2025 | 0 | 0 | 0 | 0 |
| 7 | October, 2025 | 0 | 0 | 0 | 0 |
| 8 | November, 2025 | 0 | 0 | 0 | 0 |
| 9 | December, 2025 | 0 | 0 | 0 | 0 |
| Grand Total | 0 | 0 | 0 | 0 | |
* Inclusive of complaints of previous months resolved in the current month.
# Inclusive of complaints pending as on the last day of the month.
| SN | Year | Carried forward from previous year | Received | Resolved* | Pending# |
|---|---|---|---|---|---|
| 1 | 2021-22 | 0 | 0 | 0 | 0 |
| 2 | 2022-23 | 0 | 0 | 0 | 0 |
| 3 | 2023-24 | 0 | 0 | 0 | 0 |
| 4 | 2024-25 | 0 | 0 | 0 | 0 |
| Grand Total | 0 | 0 | 0 | 0 | |
* Inclusive of complaints of previous years resolved in the current year.
# Inclusive of complaints pending as on the last day of the year.