
What USD Investors Can Learn from Nifty & the S&P 500
When the S&P 500 has led the Nifty 50 (USD) for years, it can start to look … Continued
Read more2 February 2024
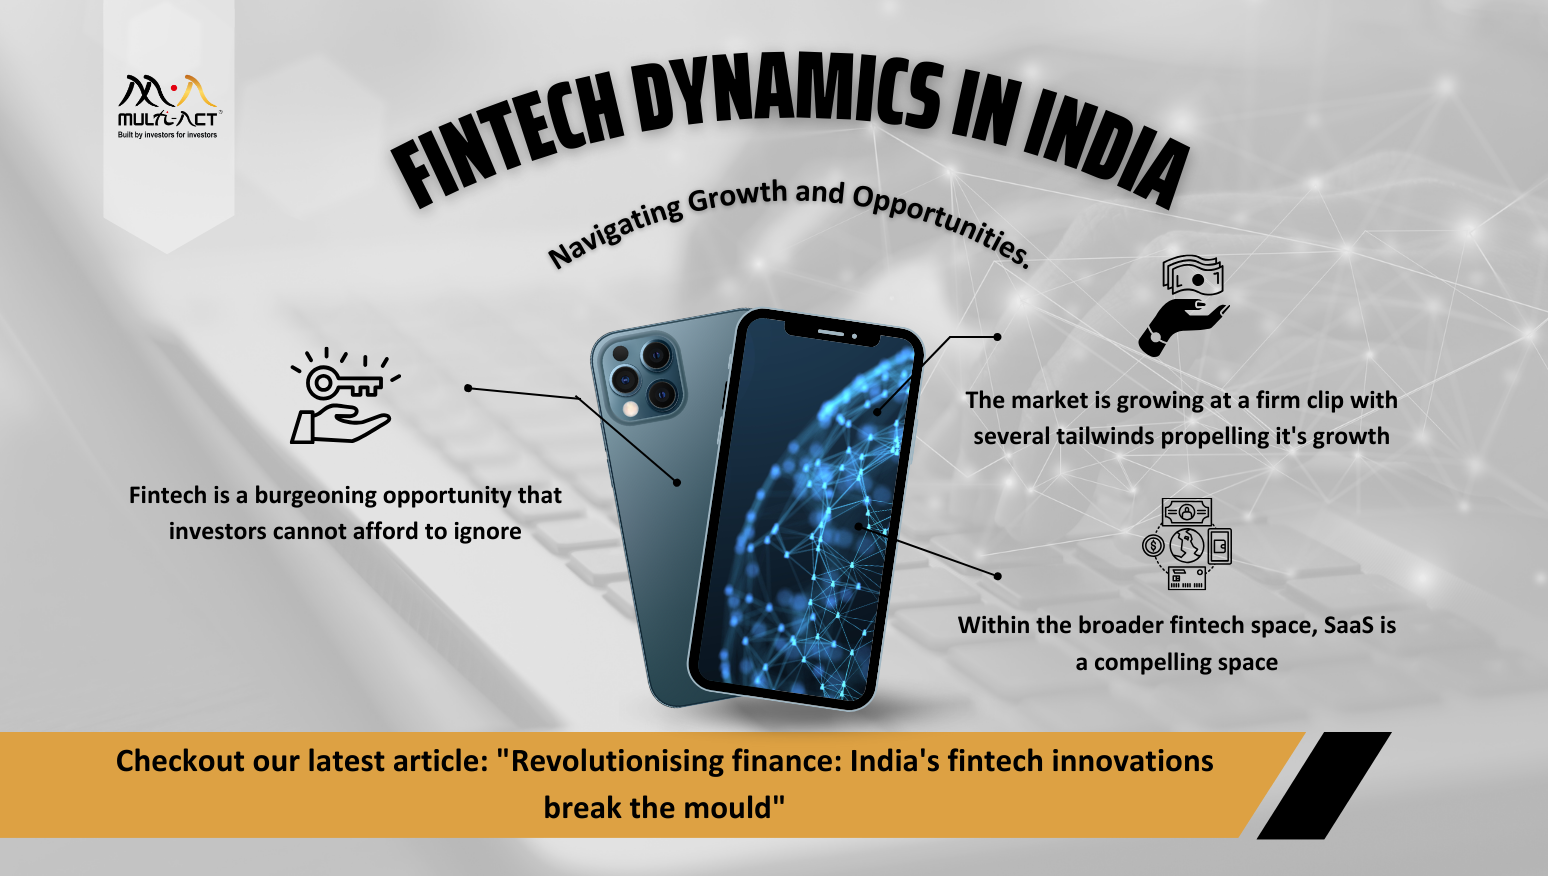
India’s fintech landscape, projected to soar to an impressive USD 150 billion by 2025, is fuelled by factors such as widespread smartphone adoption, a growing middle class, and transformative government initiatives shaping the India Stack.
The four key fintech segments – Payments, Digital Lending, InsurTech, and WealthTech – are poised for substantial expansion. In this article featured in Equalifi Journal , Multi-Act’s AIF team, Sekar Iyer, and Sanket Dabade highlight Enterprise SaaS’s pivotal role in overcoming challenges and fostering a well-rounded, accessible financial ecosystem. With India’s SaaS ecosystem expected to hit $50 billion by 2030, it offers a unique opportunity for global investors seeking strategic entry into the dynamic fintech landscape through thematic alternative investment funds.
When the S&P 500 has led the Nifty 50 (USD) for years, it can start to look … Continued
Read more
Enterprise SaaS is becoming a strategic necessity for India’s BFSI sector, with mid-sized institutions leading adoption while … Continued
Read more
Technology adoption in India’s BFSI sector is no longer only about digitisation. Enterprise Software as a Service … Continued
Read moreReceive monthly updates by signing up to our newsletter.
| Sr. No. | Received from | Pending at the end of last month | Received | Resolved* | Total Pending # | Pending complaints >3 months |
Average Resolution time^ (in days) |
| 1 | Directly from Investors | 0 | 0 | 0 | 0 | 0 | 0 |
| 2 | SEBI (SCORES) | 0 | 0 | 0 | 0 | 0 | 0 |
| 3 | Other Sources (if any) |
0 | 0 | 0 | 0 | 0 | 0 |
| Grand Total | 0 | 0 | 0 | 0 | 0 | 0 |
Number of complaints received during month against the IA due to impersonation by some other entity:
Note: In case of any complaints received against the IA due to impersonation of the IA by some other entity, the IA may adjust the number of such complaints from total number of received/resolved complaints while preparing the above table. Further, IA must close such impersonation related complaints after following the due process as specified by SEBI/ IAASB.
* Inclusive of complaints of previous months resolved in the current month.
# Inclusive of complaints pending as on the last day of the month
^ Average Resolution time is the sum total of time taken to resolve each complaint in days, in the current month divided by total number of complaints resolved in the current month.
| Sr. No. | Month | Carried forward from previous month | Received | Resolved* | Pending# |
| 1 | April, 2026 | 0 | 0 | 0 | 0 |
| 2 | May, 2026 | 0 | 0 | 0 | 0 |
| 3 | June, 2026 | 0 | 0 | 0 | 0 |
| Grand Total | 0 | 0 | 0 | 0 |
*Inclusive of complaints of previous months resolved in the current month. #Inclusive of complaints pending as on the last day of the month.
| SN | Year | Carried forward from previous year | Received | Resolved* | Pending# |
| 1 | 2022-23 | 0 | 0 | 0 | 0 |
| 2 | 2023-24 | 0 | 0 | 0 | 0 |
| 3 | 2024-25 | 0 | 0 | 0 | 0 |
| 4 | 2025-26 | 0 | 0 | 0 | 0 |
| Grand Total | 0 | 0 | 0 | 0 |
*Inclusive of complaints of previous years resolved in the current year. #Inclusive of complaints pending as on the last day of the year.