
The Scanner, Jan’26 | Update: Gold and Silver
Gold and silver are no longer just rallying. They are stretching. When prices move materially beyond historical … Continued
Read more28 November 2025

The AI story everyone sees is technological. The story that a few notice is financial.
Revolving expenditures, increasing debt levels, and valuations focused on several AI-associated companies are currently driving a massive investment wave worth trillions. Borrowing is emerging as the source of funding, altering the risk dynamics for businesses, creditors, and financial markets.
To understand the financial framework underpinning AI and the things that work against it, read our latest article below.
Gold and silver are no longer just rallying. They are stretching. When prices move materially beyond historical … Continued
Read more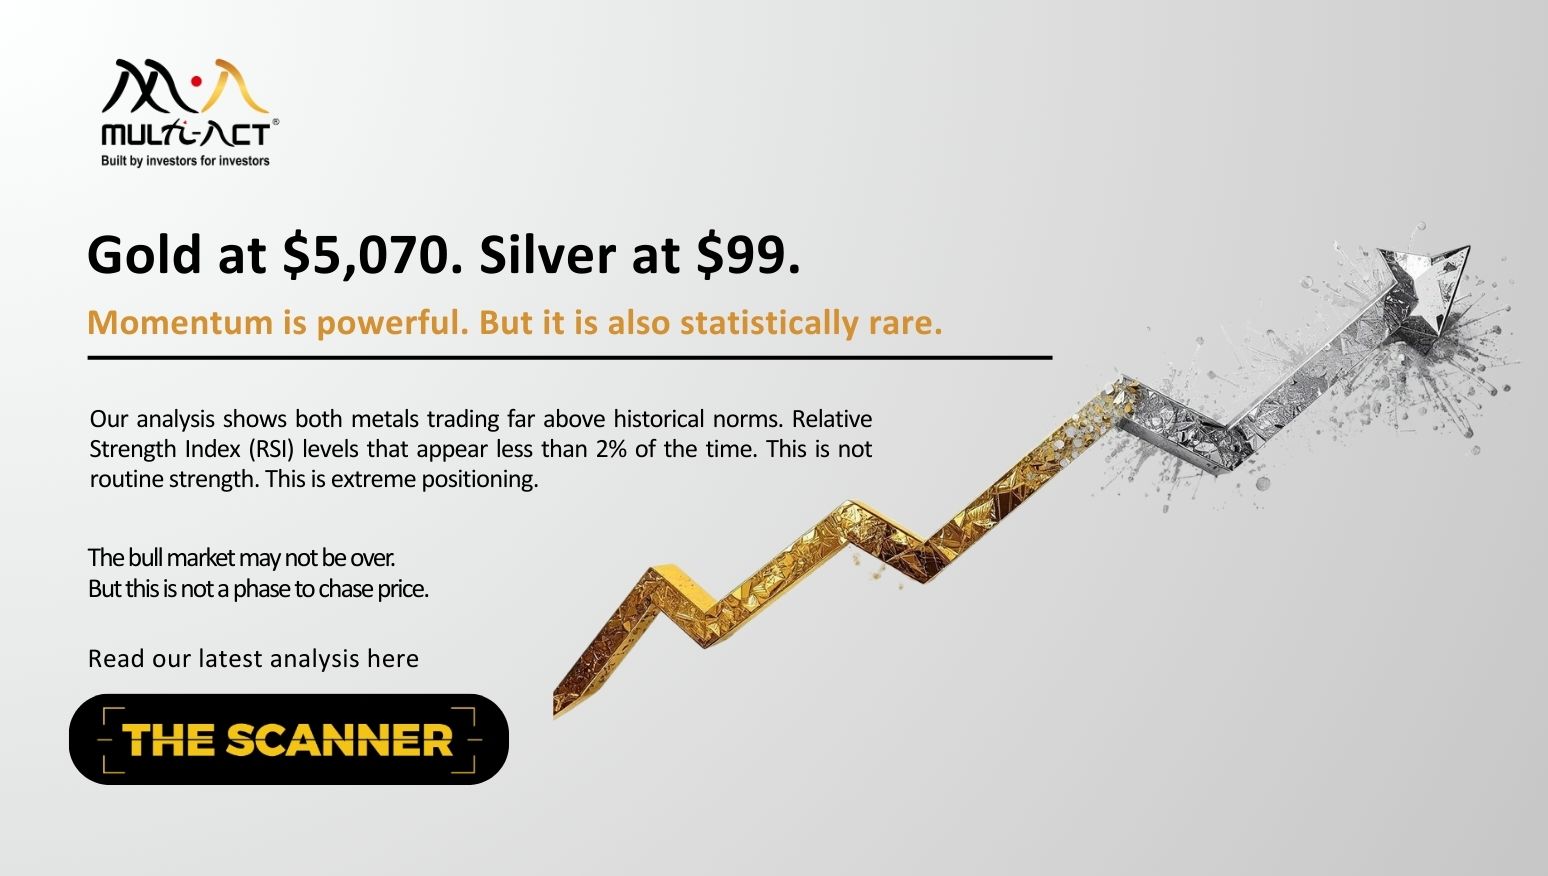
When prices rise very quickly, they often pause, or correct. In such moments, slowing down and staying … Continued
Read more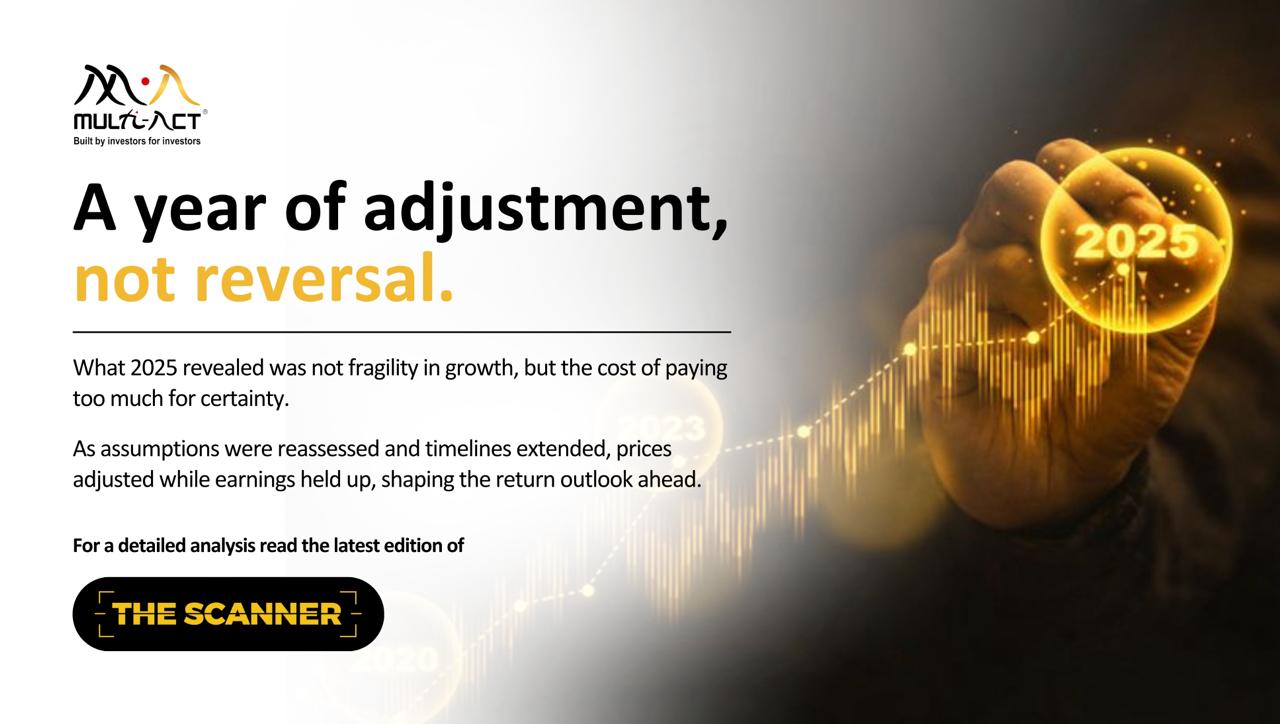
2025 did not challenge growth. It challenged assumptions. As expectations moved ahead of actual delivery, prices adjusted … Continued
Read moreReceive monthly updates by signing up to our newsletter.
| Sr. No. | Received from | Pending at the end of last month | Received | Resolved* | Total Pending# | Pending complaints > 3 months | Average Resolution time^ (in days) |
|---|---|---|---|---|---|---|---|
| 1 | Directly from Investors | 0 | 0 | 0 | 0 | 0 | 0 |
| 2 | SEBI (SCORES) | 0 | 0 | 0 | 0 | 0 | 0 |
| 3 | Other Sources (if any) | 0 | 0 | 0 | 0 | 0 | 0 |
| Grand Total | 0 | 0 | 0 | 0 | 0 | 0 | |
Number of complaints received during month against the IA due to impersonation by some other entity: Nil
Note: In case of any complaints received against the IA due to impersonation of the IA by some other entity, the IA may adjust the number of such complaints from total number of received/resolved complaints while preparing the above table. Further, IA must close such impersonation related complaints after following the due process as specified by SEBI/ IAASB.
* Inclusive of complaints of previous months resolved in the current month.
# Inclusive of complaints pending as on the last day of the month.
^ Average Resolution time is the sum total of time taken to resolve each complaint in days, in the current month divided by total number of complaints resolved in the current month.
| Sr. No. | Month | Carried forward from previous month | Received | Resolved* | Pending# |
|---|---|---|---|---|---|
| 1 | April, 2025 | 0 | 0 | 0 | 0 |
| 2 | May, 2025 | 0 | 0 | 0 | 0 |
| 3 | June, 2025 | 0 | 0 | 0 | 0 |
| 4 | July, 2025 | 0 | 0 | 0 | 0 |
| 5 | August, 2025 | 0 | 0 | 0 | 0 |
| 6 | September, 2025 | 0 | 0 | 0 | 0 |
| 7 | October, 2025 | 0 | 0 | 0 | 0 |
| 8 | November, 2025 | 0 | 0 | 0 | 0 |
| 9 | December, 2025 | 0 | 0 | 0 | 0 |
| 10 | January, 2026 | 0 | 0 | 0 | 0 |
| 11 | February, 2026 | 0 | 0 | 0 | 0 |
| Grand Total | 0 | 0 | 0 | 0 | |
* Inclusive of complaints of previous months resolved in the current month.
# Inclusive of complaints pending as on the last day of the month.
| SN | Year | Carried forward from previous year | Received | Resolved* | Pending# |
|---|---|---|---|---|---|
| 1 | 2021-22 | 0 | 0 | 0 | 0 |
| 2 | 2022-23 | 0 | 0 | 0 | 0 |
| 3 | 2023-24 | 0 | 0 | 0 | 0 |
| 4 | 2024-25 | 0 | 0 | 0 | 0 |
| Grand Total | 0 | 0 | 0 | 0 | |
* Inclusive of complaints of previous years resolved in the current year.
# Inclusive of complaints pending as on the last day of the year.