
What USD Investors Can Learn from Nifty & the S&P 500
When the S&P 500 has led the Nifty 50 (USD) for years, it can start to look … Continued
Read more12 February 2024

When I consider PSU stocks, I’m reminded of the famous song of Bob Dylan,
“The Times They Are A-Changin”.
Around 3 years ago, I wrote an article about the undervaluation of PSU stocks, emphasizing that investors should keep their eyes and mind open to exploring investment opportunities where a margin of safety is evident. Now, as I reassess them, it seems to be the exact opposite scenario.
Truly, times are changing!
The Nifty PSE Index has been the best-performing index in the past year, having risen by over 110%, compared to the Nifty 50’s approximately 23% increase during the same period. This represents a massive outperformance by the PSE index, nearly fivefold.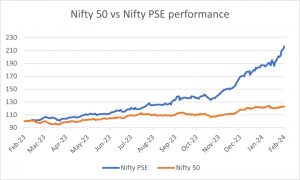 The Nifty PSE Index comprises companies in which 51% of outstanding share capital is held by the Central Government and/or State Government, directly or indirectly. This includes the likes of Coal India, NTPC, Power Grid Corp of India, GAIL, ONGC etc.
The valuation of the Nifty PSE index has recently breached +2 SD levels within a 12-year time frame. Previously, prior to the 2014 pre-election, the PSU experienced a rally.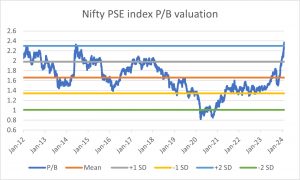 During COVID-19 (First & second wave), the index went below -2 SD levels. Since then, it has reached near mean levels and in the last 6 months or so, it went from mean levels to +2SD levels.
The rally driven by PE rerating
The recent rally in PSU stocks is primarily a result of PE rerating. In comparison, earnings growth has been largely subdued, except for a few companies. Consequently, sustaining returns hereon would be a challenge. The rerating effect was so significant that it even influenced the returns over the past three years.
The table below illustrates the breakdown of returns between EPS growth and PE rerating. It is evident that the one-year performance is mainly due to PE rerating, which also impacted the three-year performance.
The last column in the PE/PB comparison table shows the comparison between current multiples and long-term median PE multiples. Current Multiples indicate a substantial increase compared to the long-term median PE multiples.
PE Rerating Dominates Stock Returns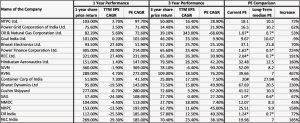 As seen in the table above, all the companies experienced a significant rerating in their PE multiples, which was a major contributor to the overall returns.
Companies such as NTPC, Power Grid Corp, RVNL, and Hindustan Aeronautics Ltd had over 90% of their returns attributable to PE rerating, while companies like SJVN, Coal India, Bharat Dynamics, Cochin Shipyard, SAIL, NMDC, NHPC, and Oil India had over 100% contribution from multiple rerating due to negative EPS growth.
There are various reasons for such a strong rally. These include boosts in government spending, multiple contract wins, a strong order book, and a focus on indigenization, especially in the case of Defense. These factors have propelled several stocks despite lackluster growth in earnings. Additionally, limited floating stock and low non-promoter ownership in some companies have led to sharp upward movements.
However, with PSU stocks priced beyond perfection, it’s essential to watch out for the following risks:
• Slowdown in growth as the government curtails its high capex outlay to moderate levels of spending.
• Potential Offer for Sale (OFS) issues with discounts, which could suppress PSU valuations, especially considering many PSU stocks have higher promoter stakes and the government may use higher valuations to meet divestment targets.
• Many commodity-focused companies (e.g. NMDC, SAIL, Nalco) have seen significant share price jumps despite no apparent fundamental shift in demand-supply cycles. These stocks could experience sharper drawdowns in case of any fundamental deterioration in industry-level dynamics.
• Inefficient capital allocation by the promoters (i.e. the government). Historical instances show that the government may not be a good capital allocator, with higher demands for dividends leading to reduced funds available for growth capex.
• PE multiples correcting and reverting to mean levels, despite strong earnings growth, could result in subdued returns.
• Earnings disappointments. If results fall short of expectations, the market is likely to derate the company’s multiple.
• Overall market correction could lead to a sharper drawdown, especially considering PSU stocks are trading at much higher valuations.
It is important to note that, in the long run, it is the earnings that drive returns. Buying a company with a margin of safety increases the probability of benefiting from PE rerating. Conversely, purchasing at elevated levels may lead to negative rerating. It’s likely that PSU stocks could face PE derating from this point onward, resulting in suboptimal returns.
The mathematical relationship between earnings growth and PE is explained below: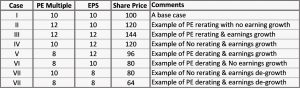 • At the simplest level, the stock price is a product of the PE multiple and EPS. Let’s assume Case I as the base scenario where the PE multiple is 10x and EPS is Rs 10. This would result in a stock price of Rs 100.
• As shown in the above table, the best-case scenario is Case III, where returns come from both earnings’ growth, as well as PE rerating, while the worst outcome is Case VIII, where both decline.
• Currently, in the case of PSU stocks, it resembles more of Case II i.e. example of PE Rerating and no/low earnings growth. Now, if the current multiple sustains and earnings grow by 20%, the entire return will be attributed to earnings growth (which is Case III). Here, the critical assumption lies is the sustainability of the PE multiple.
• If the earnings multiple reverts to the base case and earnings grow by 20%, the outcome is Case IV. In this scenario, returns from Case II to Case IV are Nil as earnings growth compensates for PE derating.
• However, if PE derating occurs despite earning growth (Case V), the returns are negative. In Case VI, where PE derating coincides with no earnings growth, the outcome is worse than in Case V.
The above framework may be helpful and serve as a guideline for investors to assess test their underlying assumptions and potential return scenarios.
Happy investing.
When the S&P 500 has led the Nifty 50 (USD) for years, it can start to look … Continued
Read more
Enterprise SaaS is becoming a strategic necessity for India’s BFSI sector, with mid-sized institutions leading adoption while … Continued
Read more
Technology adoption in India’s BFSI sector is no longer only about digitisation. Enterprise Software as a Service … Continued
Read moreReceive monthly updates by signing up to our newsletter.
| Sr. No. | Received from | Pending at the end of last month | Received | Resolved* | Total Pending # | Pending complaints >3 months |
Average Resolution time^ (in days) |
| 1 | Directly from Investors | 0 | 0 | 0 | 0 | 0 | 0 |
| 2 | SEBI (SCORES) | 0 | 0 | 0 | 0 | 0 | 0 |
| 3 | Other Sources (if any) |
0 | 0 | 0 | 0 | 0 | 0 |
| Grand Total | 0 | 0 | 0 | 0 | 0 | 0 |
Number of complaints received during month against the IA due to impersonation by some other entity:
Note: In case of any complaints received against the IA due to impersonation of the IA by some other entity, the IA may adjust the number of such complaints from total number of received/resolved complaints while preparing the above table. Further, IA must close such impersonation related complaints after following the due process as specified by SEBI/ IAASB.
* Inclusive of complaints of previous months resolved in the current month.
# Inclusive of complaints pending as on the last day of the month
^ Average Resolution time is the sum total of time taken to resolve each complaint in days, in the current month divided by total number of complaints resolved in the current month.
| Sr. No. | Month | Carried forward from previous month | Received | Resolved* | Pending# |
| 1 | April, 2026 | 0 | 0 | 0 | 0 |
| 2 | May, 2026 | 0 | 0 | 0 | 0 |
| 3 | June, 2026 | 0 | 0 | 0 | 0 |
| Grand Total | 0 | 0 | 0 | 0 |
*Inclusive of complaints of previous months resolved in the current month. #Inclusive of complaints pending as on the last day of the month.
| SN | Year | Carried forward from previous year | Received | Resolved* | Pending# |
| 1 | 2022-23 | 0 | 0 | 0 | 0 |
| 2 | 2023-24 | 0 | 0 | 0 | 0 |
| 3 | 2024-25 | 0 | 0 | 0 | 0 |
| 4 | 2025-26 | 0 | 0 | 0 | 0 |
| Grand Total | 0 | 0 | 0 | 0 |
*Inclusive of complaints of previous years resolved in the current year. #Inclusive of complaints pending as on the last day of the year.