
B2B Saas in Fintech: An Unfolding Growth Story
Technology adoption in India’s BFSI sector is no longer only about digitisation. Enterprise Software as a Service … Continued
Read more9 February 2024
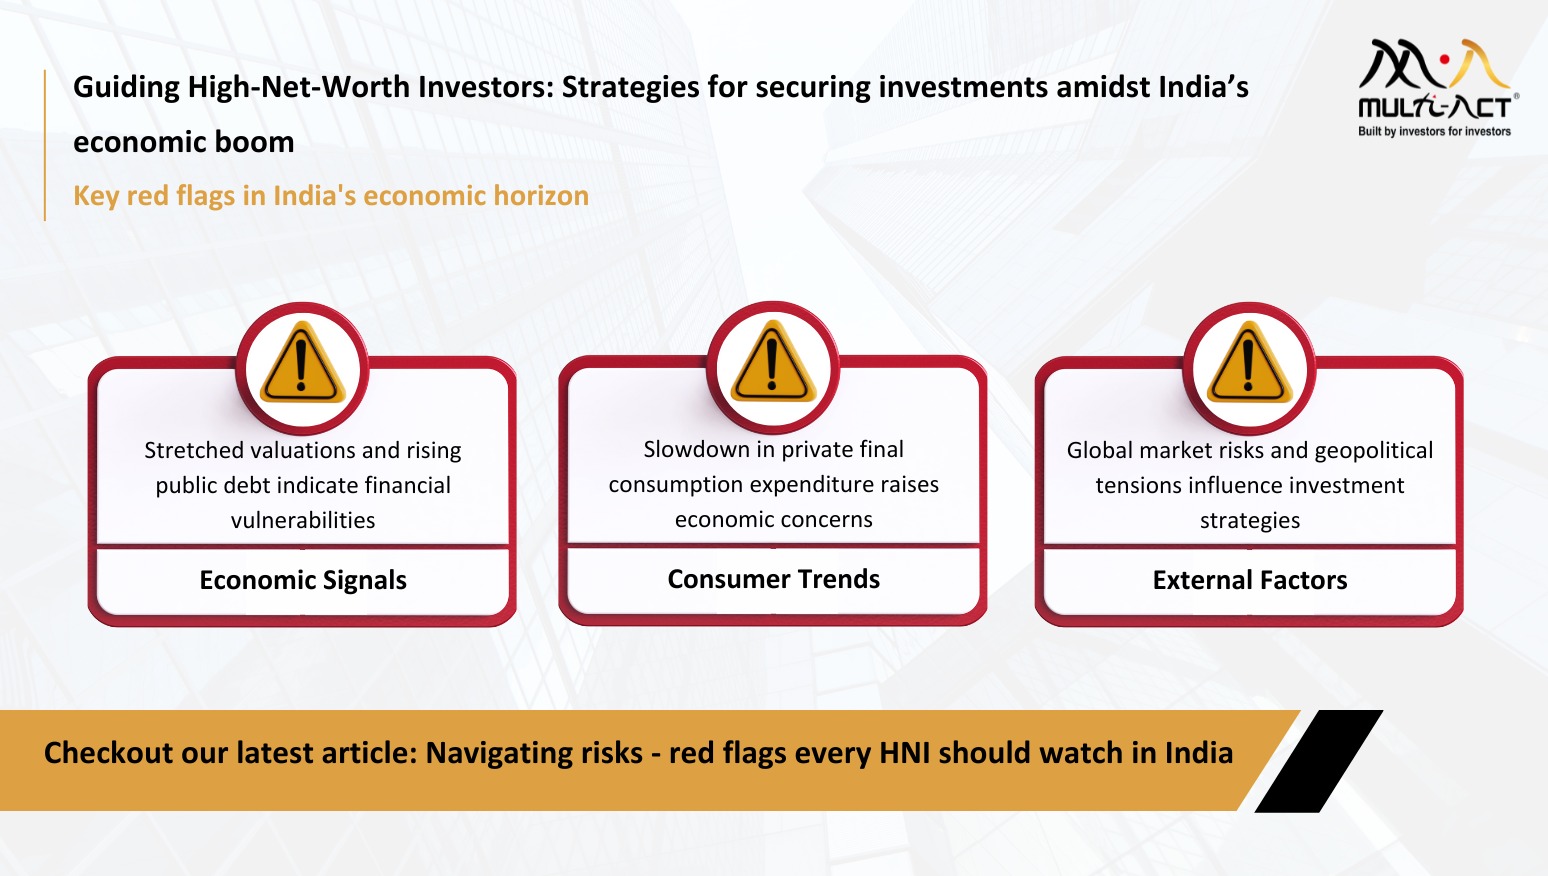
The Indian economy is on a promising trajectory, with expectations of robust GDP growth surpassing 6.5% in the current fiscal year. Vital sectors like construction, manufacturing, and finance are driving this momentum, positioning India to potentially surpass China in foreign investment attraction by 2027. However, investors must remain vigilant amidst this optimism.
Multi-Act’s Research Analyst, Aman Jain, shares insights on the warning signs investors should heed—stretched stock market valuations, government expenditure dynamics, slowdowns in private consumption, global market risks, and geopolitical tensions pose cautionary signals.
Technology adoption in India’s BFSI sector is no longer only about digitisation. Enterprise Software as a Service … Continued
Read more
Fund selection is often guided by past returns. But returns are an outcome. They do not explain … Continued
Read more
Gold and silver are no longer just rallying. They are stretching. When prices move materially beyond historical … Continued
Read moreReceive monthly updates by signing up to our newsletter.
| Sr. No. | Received from | Pending at the end of last month | Received | Resolved* | Total Pending # | Pending complaints >3 months |
Average Resolution time^ (in days) |
| 1 | Directly from Investors | 0 | 0 | 0 | 0 | 0 | 0 |
| 2 | SEBI (SCORES) | 0 | 0 | 0 | 0 | 0 | 0 |
| 3 | Other Sources (if any) |
0 | 0 | 0 | 0 | 0 | 0 |
| Grand Total | 0 | 0 | 0 | 0 | 0 | 0 |
Number of complaints received during month against the IA due to impersonation by some other entity:
Note: In case of any complaints received against the IA due to impersonation of the IA by some other entity, the IA may adjust the number of such complaints from total number of received/resolved complaints while preparing the above table. Further, IA must close such impersonation related complaints after following the due process as specified by SEBI/ IAASB.
* Inclusive of complaints of previous months resolved in the current month.
# Inclusive of complaints pending as on the last day of the month
^ Average Resolution time is the sum total of time taken to resolve each complaint in days, in the current month divided by total number of complaints resolved in the current month.
| Sr. No. | Month | Carried forward from previous month | Received | Resolved* | Pending# |
| 1 | April, 2026 | 0 | 0 | 0 | 0 |
| 2 | May, 2026 | 0 | 0 | 0 | 0 |
| Grand Total | 0 | 0 | 0 | 0 |
*Inclusive of complaints of previous months resolved in the current month. #Inclusive of complaints pending as on the last day of the month.
| SN | Year | Carried forward from previous year | Received | Resolved* | Pending# |
| 1 | 2022-23 | 0 | 0 | 0 | 0 |
| 2 | 2023-24 | 0 | 0 | 0 | 0 |
| 3 | 2024-25 | 0 | 0 | 0 | 0 |
| 4 | 2025-26 | 0 | 0 | 0 | 0 |
| Grand Total | 0 | 0 | 0 | 0 |
*Inclusive of complaints of previous years resolved in the current year. #Inclusive of complaints pending as on the last day of the year.