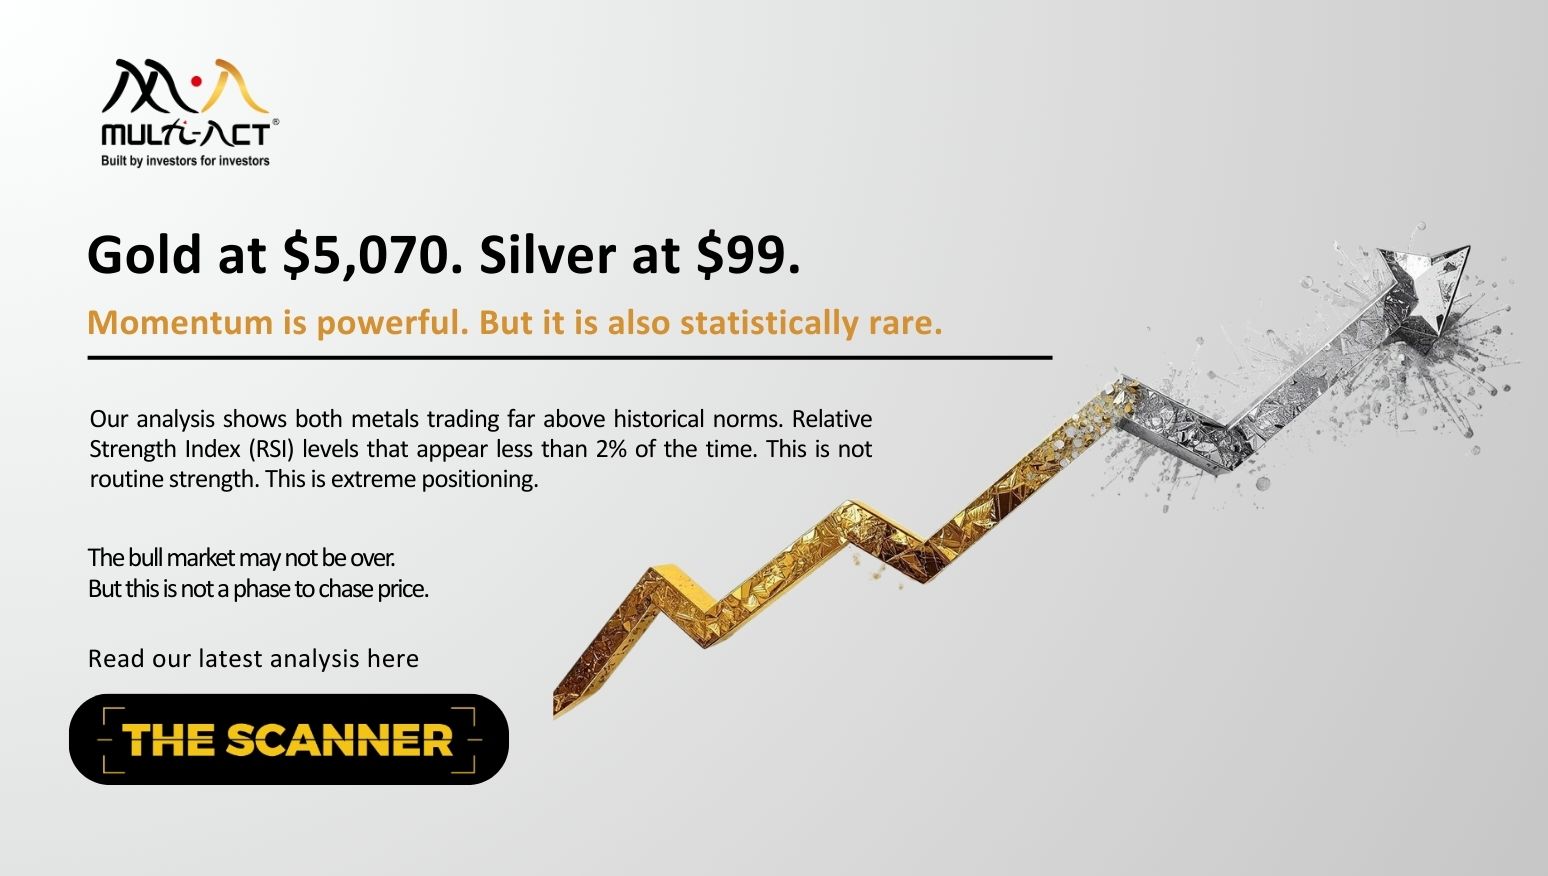
The Scanner, Jan’26 | Gold and Silver : Opportunity or overheating?
When prices rise very quickly, they often pause, or correct. In such moments, slowing down and staying … Continued
Read more16 October 2017
As the equity bull market has entered its ninth year, market participants have voiced concerns over elevated valuation levels. John Hussman has been one of the more prominent who have sounded the warning bells about low expected returns and elevated risks embedded in equity valuations. In his recent note, Hussman stated that few investors recognize that one of the reasons why valuation multiples were so rich in 2000 is that profit margins were actually below historical norms at the time. The benefit of normalizing the embedded profit margin comes not just from muting margins that are above historical norms, but also from normalizing margins in periods where they are below historical norms.

When prices rise very quickly, they often pause, or correct. In such moments, slowing down and staying … Continued
Read more
2025 did not challenge growth. It challenged assumptions. As expectations moved ahead of actual delivery, prices adjusted … Continued
Read more
Macro numbers alone rarely tell the full story. When jobs, consumption, credit, and inflation are considered together, … Continued
Read moreReceive monthly updates by signing up to our newsletter.
| Sr. No. | Received from | Pending at the end of last month | Received | Resolved* | Total Pending # | Pending complaints > 3 months | Average Resolution time^ (in days) |
|---|---|---|---|---|---|---|---|
| 1 | Directly from Investors | 0 | 0 | 0 | 0 | 0 | 0 |
| 2 | SEBI (SCORES) | 0 | 0 | 0 | 0 | 0 | 0 |
| 3 | Other Sources (if any) | 0 | 0 | 0 | 0 | 0 | 0 |
| Grand Total | 0 | 0 | 0 | 0 | 0 | 0 | |
Number of complaints received during month against the IA due to impersonation by some other entity: Nil
Note: In case of any complaints received against the IA due to impersonation of the IA by some other entity, the IA may adjust the number of such complaints from total number of received/resolved complaints while preparing the above table. Further, IA must close such impersonation related complaints after following the due process as specified by SEBI/ IAASB.
* Inclusive of complaints of previous months resolved in the current month.
# Inclusive of complaints pending as on the last day of the month.
^ Average Resolution time is the sum total of time taken to resolve each complaint in days, in the current month divided by total number of complaints resolved in the current month.
| Sr. No. | Month | Carried forward from previous month | Received | Resolved* | Pending# |
|---|---|---|---|---|---|
| 1 | April, 2025 | 0 | 0 | 0 | 0 |
| 2 | May, 2025 | 0 | 0 | 0 | 0 |
| 3 | June, 2025 | 0 | 0 | 0 | 0 |
| 4 | July, 2025 | 0 | 0 | 0 | 0 |
| 5 | August, 2025 | 0 | 0 | 0 | 0 |
| 6 | September, 2025 | 0 | 0 | 0 | 0 |
| 7 | October, 2025 | 0 | 0 | 0 | 0 |
| 8 | November, 2025 | 0 | 0 | 0 | 0 |
| 9 | December, 2025 | 0 | 0 | 0 | 0 |
| Grand Total | 0 | 0 | 0 | 0 | |
* Inclusive of complaints of previous months resolved in the current month.
# Inclusive of complaints pending as on the last day of the month.
| SN | Year | Carried forward from previous year | Received | Resolved* | Pending# |
|---|---|---|---|---|---|
| 1 | 2021-22 | 0 | 0 | 0 | 0 |
| 2 | 2022-23 | 0 | 0 | 0 | 0 |
| 3 | 2023-24 | 0 | 0 | 0 | 0 |
| 4 | 2024-25 | 0 | 0 | 0 | 0 |
| Grand Total | 0 | 0 | 0 | 0 | |
* Inclusive of complaints of previous years resolved in the current year.
# Inclusive of complaints pending as on the last day of the year.