
What USD Investors Can Learn from Nifty & the S&P 500
When the S&P 500 has led the Nifty 50 (USD) for years, it can start to look … Continued
Read more14 April 2020
This article was originally published on Valuewalk.
“Life and investing are long ballgames.”
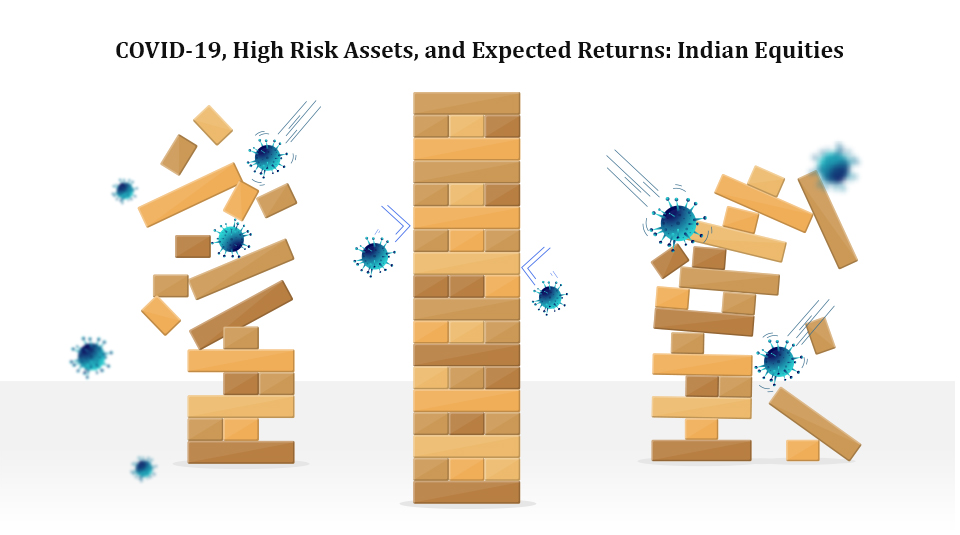
— Julian RobertsonOn March 24th, India implemented a countrywide lockdown that continues to be in force as of this writing. The scale of the lockdown in unprecedented with the country’s 1.3 billion people ordered to stay within the confines of their homes. As of this writing, there is significant uncertainty around Wuhan coronavirus’s (COVID-19) primary variables that are required for modeling the impact of the pandemic. While COVID-19’s direct consequences in terms of health impact have significant uncertainty associated with them, the second and third order consequences related to lockdowns are even harder to model and fathom.
What we can say with reasonably high confidence though, is that the pandemic will have lasting impacts. For many businesses, it will necessitate significant shifts in their business models. The uncertainty of potential outcomes triggered a wave of liquidations that saw most market segments down by nearly 40% on a year to date basis. Figure 1 shows the performance of the NIFTY 50 index, the NIFTY Midcap index, and the NIFTY Small cap index during Q1 2020. As is seen, each one of the segments registered deep declines with an average decline of 40% across the three segments as compared to the prices recorded on the 7th of February.

Source: Data from investing.com
Figure 2 shows the performance of primary sectors of the Indian equity markets as represented by various NIFTY sector indices. While the initial wave of the selling resulted in fairly similar price changes across sectors, towards the end, significant differences emerged. The Auto, Banks, and Realty sectors performed the worst with average declines of 45% while the Pharma, IT, and FMCG sectors held up well registering average declines of 27%.

Source: Data from investing.com
As is generally the case, periods of crises are associated with the depreciation of rupee against the dollar. This time was no different either. At its lows, the Indian rupee depreciated by 6.5% against the US dollar. Figure 2 shows the performance of Indian Rupee against the US Dollar.

Source: data from investing.com
In our Q2 2019 letter, we highlighted NBFCs as one area which had become the interest of speculation between late 2016 and early 2018. We offered a comparison of the performance of a basket of NBFCs to that of the equity basket of the Fund. In that letter, we contended that the excess performance of NBFC basket was in the process of being erased.
Figure 4 provides an updated chart. As is seen, all the outperformance of the NBFC basket was indeed erased and then some. As we stated in that letter, “The higher risk of a basket of securities does not guarantee higher returns. It only offers a chance of higher returns.” The issue with such speculative baskets is that they destroy capital right when you need it the most; during periods of crises.

Source: Sapphire’s calculations, data from Factset
To offer further perspective on this characteristic, we set up a strategy by pulling up a list of the largest five hundred companies by market capitalization as of October 1st every year starting in 2016. We then removed all banking, financial, and utility companies from our analysis. Finally, we selected the top quartile of companies based on their leverage levels1 to represent the most financially leveraged businesses. This process was then repeated every year.
1 While traditionally Wall Street uses Debt/EBITDA ratios as the metric, we prefer to use Debt/Operating Cash Flows as cash is not subject to accounting gimmickry; an important issue when dealing into Indian equities.
To ensure that we were using data that was indeed available in the public domain, we built the index as of October 1st which allows for a six-month lag period as most Indian companies have a March year-end. We chose to 2016 as the starting year as it was right before the big rally of 2017.
As is seen, as the 2017 rally took over, the most financially leveraged basket of companies generated significantly superior performance as compared to the Fund’s equity portfolio. However, as is seen in Figure 5, that outperformance has since more than reversed.
FIGURE 5: PERFORMANCE OF MOST LEVERAGED COMPANIES AND IMF’S EQUITY PORTFOLIO

Source: Sapphire’s calculations, data from Factset
At India Moats Fund, the core of what we do is to own a basket of businesses that in our opinion possess durable competitive advantages. While there are more than five thousand companies listed on Indian bourses, there are just a handful of companies that truly have durable competitive advantages. We then remove businesses that are beset with corporate governance or quality of earnings issues. We find that there are just about fifty businesses in Indian equity markets that satisfy all our requirements.
Our stringent investment requirements have ensured that we have avoided most landmines that have affected investment portfolios. We think it is important to keep in mind that investing is akin to marathon and not a sprint. To provide for easy comparison, in Figure 6, we have shown the performance of our investment portfolio in Indian Rupees along with that of the NIFTY 50 index and the NIFTY Midcap 100 index. As is seen, we have generated superior returns during the overall period while enduring much lower declines compared to the broader markets.

Source: Sapphire’s calculations, Index data from investing.com
Figure 7 shows the average estimated 10-year returns2 for companies comprised in the India Moats Index (IMI3). As is seen, our current estimate of the 10-year return is the highest of the past five years.
2As the basket of companies includes just about fifty companies, outliers have a meaningful impact on the averages. Accordingly, we have winsorized the data by removing the top 10% and the bottom 10% of readings.
3 IMI is a proprietary index of Sapphire that is comprised of businesses that in our opinion possess durable competitive advantages and are devoid of corporate governance and quality of earnings issues.

The Wuhan coronavirus pandemic has given rise to significant uncertainties for the economic and business environment. However, as we have depicted in our previous letters as well as in this one, the higher risk baskets when held for long enough periods, generate extremely poor outcomes for their owners. The important lesson here is that most stocks, at best, represent trading opportunities akin to one-night stands. Only a handful represent businesses that generate superior investment returns over extended periods. Importantly, the current prices are starting to allow for superior investment returns and warrant increasing investment allocations.
Stay safe. We wish the best to your investing.
Baijnath Ramraika, CFA, is a cofounder and the CEO & CIO of Multi-Act Equiglobe (MAEG) Limited and is the Executive Director at Sapphire Capital. As a portfolio manager, he manages the Global Moats Fund and the India Moats Fund. Contact him at baijnath@maegcapital.com. Baijnath’s thoughts and ideas can be read at his blog at www.symantaka.com
Prashant K. Trivedi, CFA, is a cofounder of MAEG and the founder and chairman of Multi-Act Trade and Investments Pvt. Ltd.
MAEG is an investment manager and manages the Global Moats Fund, an investment fund that invests in a global portfolio of high-quality businesses with sustainable competitive advantages. Sapphire manages the India Moats Fund, an investment fund that invests in a portfolio of high-quality Indian businesses with sustainable competitive advantages.
Multi-Act is a financial services provider operating an investment advisory business and an independent equity research services business based in Mumbai, India.
Statutory Details: Multi-Act Equity Consultancy Private Limited
(SEBI Registered Portfolio Manager – Registration No. INP000002965)
Disclaimer and Disclosure:
The views expressed in this article are for educational and reading purpose only. Multi-Act Equity Consultancy Private Limited (MAECL) does not solicit any course of action based on these views and the reader is advised to exercise independent judgment and act upon the same based on its/his/her sole discretion, their own investigations and risk-reward preferences. This article and the information do not constitute a distribution, an endorsement, an investment advice, an offer to buy or sell or the solicitation of an offer to buy or sell any securities mentioned in this Document or an attempt to influence the opinion or behaviour of the Investors/Recipients.
The article is prepared on the basis of publicly available information, internally developed data and from sources believed to be reliable. Due care has been taken to ensure that the facts are accurate and the views are fair.
MAECL, its associates or any of their respective directors, employees, affiliates or representatives do not assume any responsibility for, or warrant the accuracy, completeness, adequacy and reliability of such views and consequently are not liable for any direct, indirect, special, incidental, consequential, punitive or exemplary damages, including lost profits arising in any way for decisions taken based on the said article.
It is stated that, as permitted by SEBI Regulations and the Company’s Employee Dealing Policy, the associates, employees, affiliates of MAECL may have interests in securities referred to in the information. The contents herein – information or views – do not amount to distribution, guidelines, an offer or solicitation of any offer to buy or sell any securities or financial instruments, directly or indirectly, in the United States of America (US), in Canada, in jurisdictions where such distribution or offer is not authorized and in FATF non-compliant jurisdiction and are particularly not for US persons (being persons resident in the US, corporations, partnerships or other entities created or organized in or under the laws of the US or any person falling within the definition of the term “US person” under Regulation S promulgated under the US Securities Act of 1933, as amended) and persons of Canada.
Risk factors
General risk factors
When the S&P 500 has led the Nifty 50 (USD) for years, it can start to look … Continued
Read more
Enterprise SaaS is becoming a strategic necessity for India’s BFSI sector, with mid-sized institutions leading adoption while … Continued
Read more
Technology adoption in India’s BFSI sector is no longer only about digitisation. Enterprise Software as a Service … Continued
Read moreReceive monthly updates by signing up to our newsletter.
| Sr. No. | Received from | Pending at the end of last month | Received | Resolved* | Total Pending # | Pending complaints >3 months |
Average Resolution time^ (in days) |
| 1 | Directly from Investors | 0 | 0 | 0 | 0 | 0 | 0 |
| 2 | SEBI (SCORES) | 0 | 0 | 0 | 0 | 0 | 0 |
| 3 | Other Sources (if any) |
0 | 0 | 0 | 0 | 0 | 0 |
| Grand Total | 0 | 0 | 0 | 0 | 0 | 0 |
Number of complaints received during month against the IA due to impersonation by some other entity:
Note: In case of any complaints received against the IA due to impersonation of the IA by some other entity, the IA may adjust the number of such complaints from total number of received/resolved complaints while preparing the above table. Further, IA must close such impersonation related complaints after following the due process as specified by SEBI/ IAASB.
* Inclusive of complaints of previous months resolved in the current month.
# Inclusive of complaints pending as on the last day of the month
^ Average Resolution time is the sum total of time taken to resolve each complaint in days, in the current month divided by total number of complaints resolved in the current month.
| Sr. No. | Month | Carried forward from previous month | Received | Resolved* | Pending# |
| 1 | April, 2026 | 0 | 0 | 0 | 0 |
| 2 | May, 2026 | 0 | 0 | 0 | 0 |
| 3 | June, 2026 | 0 | 0 | 0 | 0 |
| Grand Total | 0 | 0 | 0 | 0 |
*Inclusive of complaints of previous months resolved in the current month. #Inclusive of complaints pending as on the last day of the month.
| SN | Year | Carried forward from previous year | Received | Resolved* | Pending# |
| 1 | 2022-23 | 0 | 0 | 0 | 0 |
| 2 | 2023-24 | 0 | 0 | 0 | 0 |
| 3 | 2024-25 | 0 | 0 | 0 | 0 |
| 4 | 2025-26 | 0 | 0 | 0 | 0 |
| Grand Total | 0 | 0 | 0 | 0 |
*Inclusive of complaints of previous years resolved in the current year. #Inclusive of complaints pending as on the last day of the year.