
The Scanner, Mar’26 | Looking beyond Returns: Decoding MF Selection through QVM
Fund selection is often guided by past returns. But returns are an outcome. They do not explain … Continued
Read more5 October 2021

Imagine you have just boarded a train. On the left side of the train, there is a platform from which you had just boarded and there is another train on the right. You realise that the other train on the right side has moved slightly, but you are not sure – is my train moving or is it the other one or both are moving? So, you look at the window on your left, looking at the platform now you are certain what has happened. What you have done is use the platform as the reference point to arrive at the conclusion or in other words, use the platform as a benchmark.
Benchmarking is a critical aspect of mutual fund analysis as well. Benchmark selection is very important, and it has a bearing on the overall conclusion.
We will dig deeper into it with an example of funds from the midcap category.

This is a chart that we had shared in an earlier post which highlights that in the midcap category, most of the funds underperformed from 2017 to 2019 but have started outperforming again in recent periods.
In underlying calculations, we had used benchmarks that the mutual funds themselves have declared in their statutory disclosures. Even though funds in the midcap category have the same mandate of investing in midcap space, the benchmark selected differs slightly. Following is the break-up of different indices used as the benchmark:

We pondered over some questions looking at this data – How would the outperformance distribution chart look if we were to use a common benchmark instead of fund-assigned ones? If we are to use a common benchmark, which one should it be?
SEBI has made it easier for us to answer these questions. SEBI has defined midcap stocks as those that are ranked 101 to 250 based on market capitalization. This means that ‘Nifty Midcap 150’ fits the bill.
(Note: Nifty Midcap 100 is a subset of Nifty Midcap 150, and S&P BSE Midcap is based on the percentage of market cap covered instead of the number of midcap stocks)
Updated chart with the common benchmark as ‘Nifty Midcap 150’ looks like this:


A noticeable part of the comparison is that the earlier period (somewhere till Mar 2019 or so) looks almost similar in both the charts, but there is visible divergence in recent times. Green area has started to increase in ‘Actual’ chart whereas it is at the same levels in ‘Common’ chart.
To understand this divergence better, we plotted 3-year rolling returns of all 3 indices – Nifty Midcap 150, Nifty Midcap 100, and S&P BSE Midcap:

Most of the time, Nifty Midcap 150 has reported higher rolling returns than the other 2 indices. Below charts make this point perfectly clear:

Most of the funds in the midcap category are using either Nifty Midcap 100 or S&P BSE Midcap as their benchmark. However, these 2 indices did not fare as well as Nifty Midcap 150 (which we have considered as a common benchmark for the category) across timeframes. This is the reason for the divergence in the ‘Actual’ and ‘Common’ charts.
This example highlights the importance of using an appropriate benchmark while analysing any fund and how the conclusion changes when we change the benchmark. The category which has started to outperform based on the ‘Actual’ chart does not seem to be doing any better based on the ‘Common’ chart. Right benchmarking exercise will allow us to understand whether we are on a moving train or are still stationary near the platform.
Rational investing, Happy Investing!
Fund selection is often guided by past returns. But returns are an outcome. They do not explain … Continued
Read more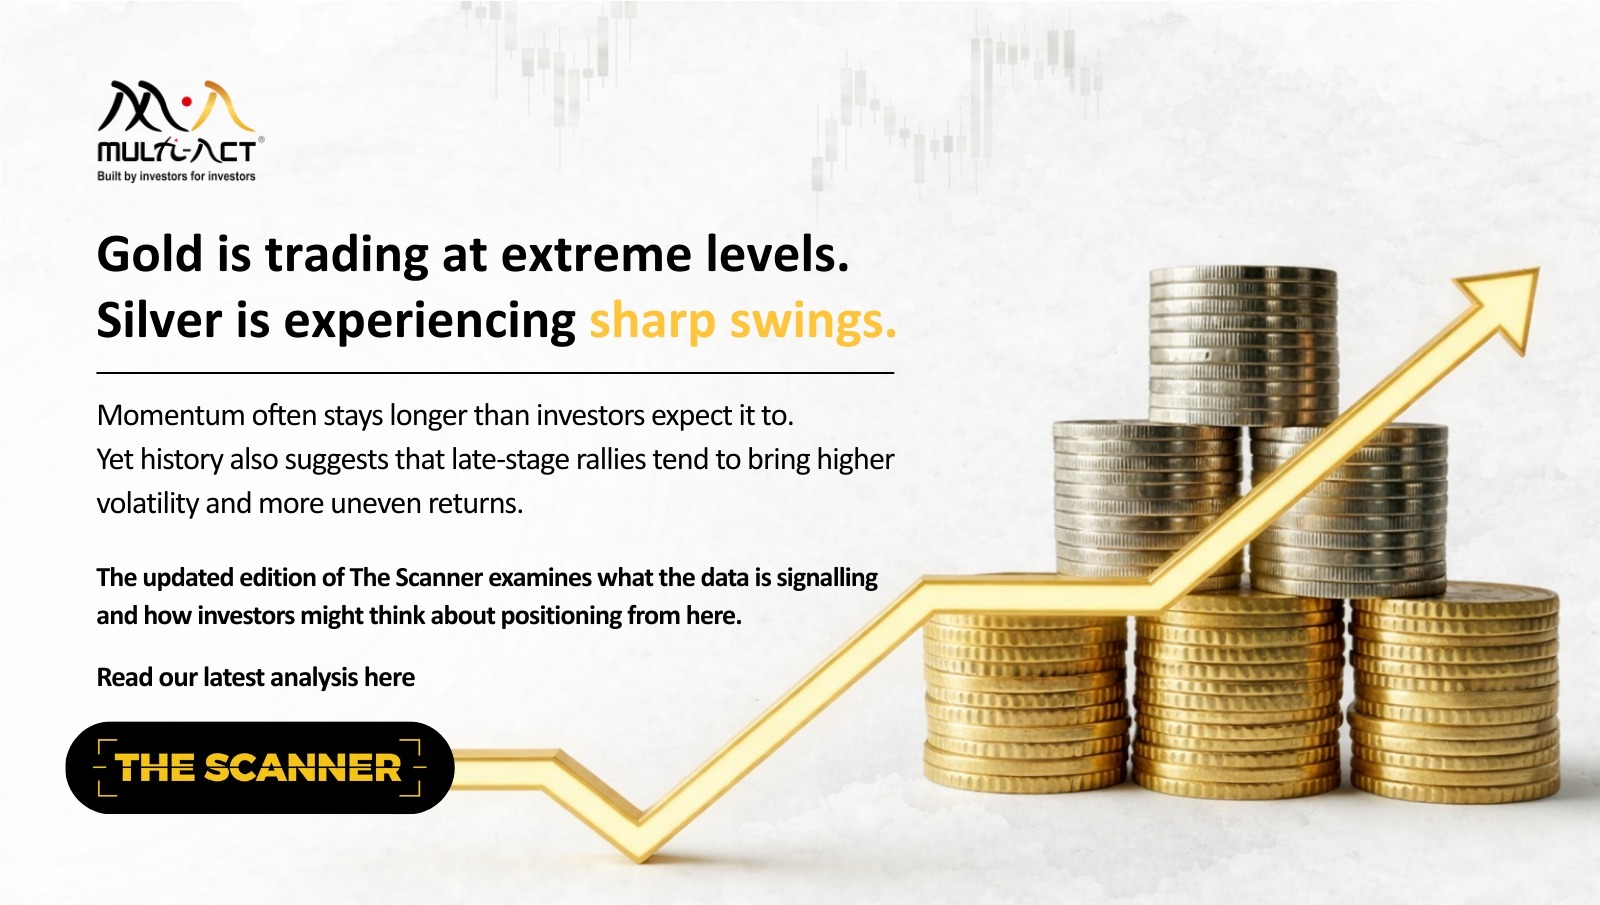
Gold and silver are no longer just rallying. They are stretching. When prices move materially beyond historical … Continued
Read more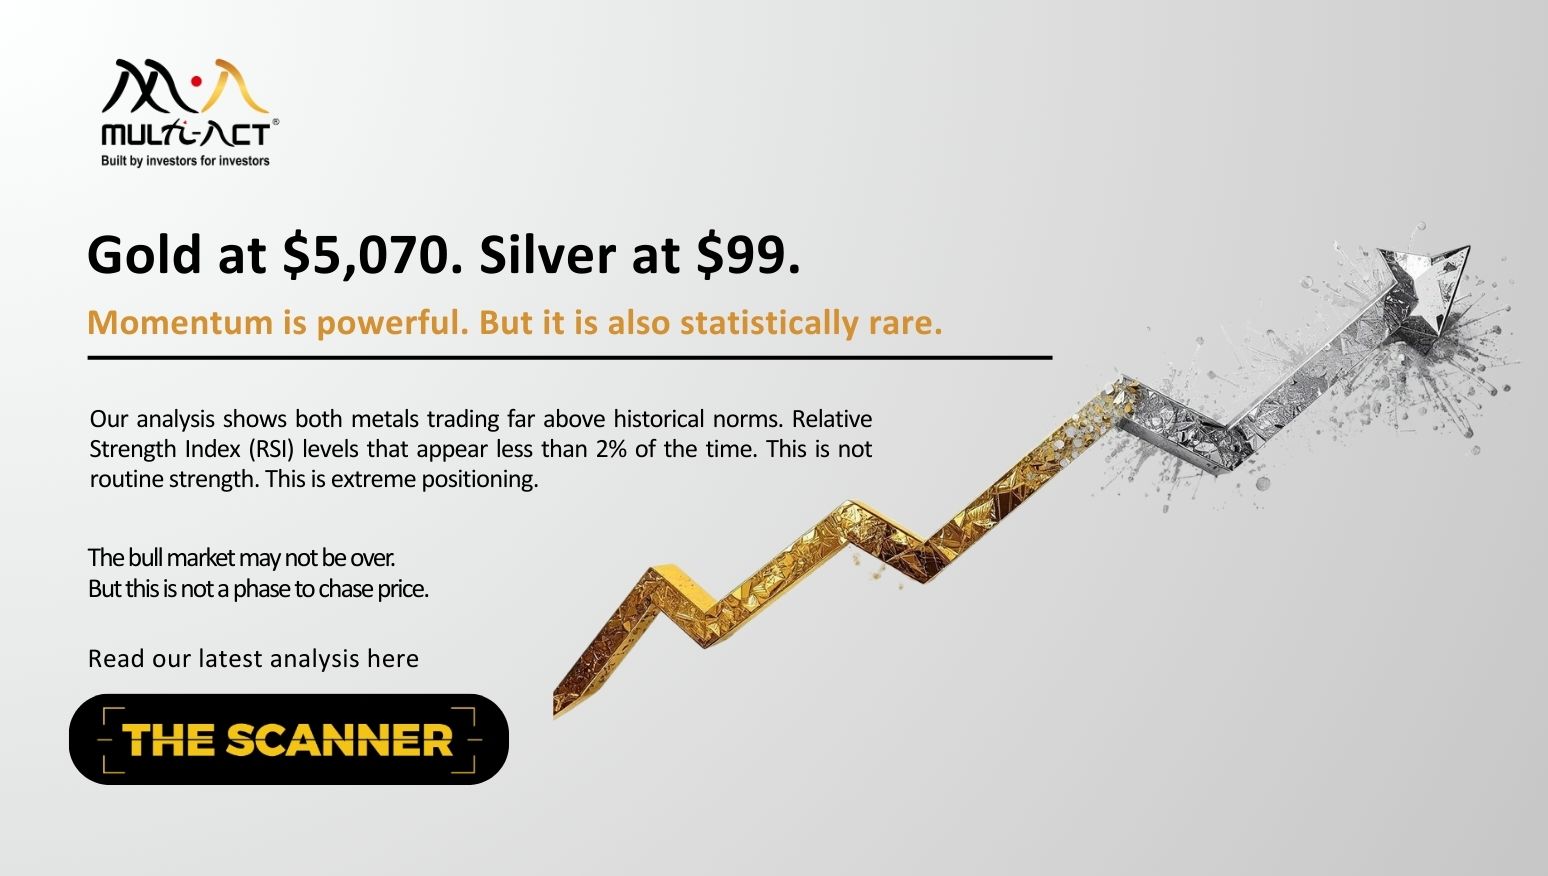
When prices rise very quickly, they often pause, or correct. In such moments, slowing down and staying … Continued
Read moreReceive monthly updates by signing up to our newsletter.
|
Sr. No. |
Received from |
Pending at the end of last month |
Received |
Resolved* |
Total Pending # |
Pending complaints > 3 months |
Average Resolution time^ (in days) |
|
1 |
Directly from Investors |
0 |
0 |
0 |
0 |
0 |
0 |
|
2 |
SEBI (SCORES) |
0 |
0 |
0 |
0 |
0 |
0 |
|
3 |
Other Sources (if any) |
0 |
0 |
0 |
0 |
0 |
0 |
|
|
Grand Total |
0 |
0 |
0 |
0 |
0 |
0 |
Number of complaints received during month against the IA due to impersonation by some other entity:
Note: In case of any complaints received against the IA due to impersonation of the IA by some other entity, the IA may adjust the number of such complaints from total number of received/resolved complaints while preparing the above table. Further, IA must close such impersonation related complaints after following the due process as specified by SEBI/ IAASB.
* Inclusive of complaints of previous months resolved in the current month.
# Inclusive of complaints pending as on the last day of the month
^ Average Resolution time is the sum total of time taken to resolve each complaint in days, in the current month divided by total number of complaints resolved in the current month.
|
Sr. No. |
Month |
Carried forward from previous month |
Received |
Resolved* |
Pending# |
|
1 |
April, 2026 |
0 |
0 |
0 |
0 |
|
|
Grand Total |
0 |
0 |
0 |
0 |
*Inclusive of complaints of previous months resolved in the current month. #Inclusive of complaints pending as on the last day of the month.
|
SN |
Year |
Carried forward from previous year |
Received |
Resolved* |
Pending# |
|
1 |
2022-23 |
0 |
0 |
0 |
0 |
|
2 |
2023-24 |
0 |
0 |
0 |
0 |
|
3 |
2024-25 |
0 |
0 |
0 |
0 |
|
4 |
2025-26 |
0 |
0 |
0 |
0 |
|
|
Grand Total |
0 |
0 |
0 |
0 |
*Inclusive of complaints of previous years resolved in the current year. #Inclusive of complaints pending as on the last day of the year.