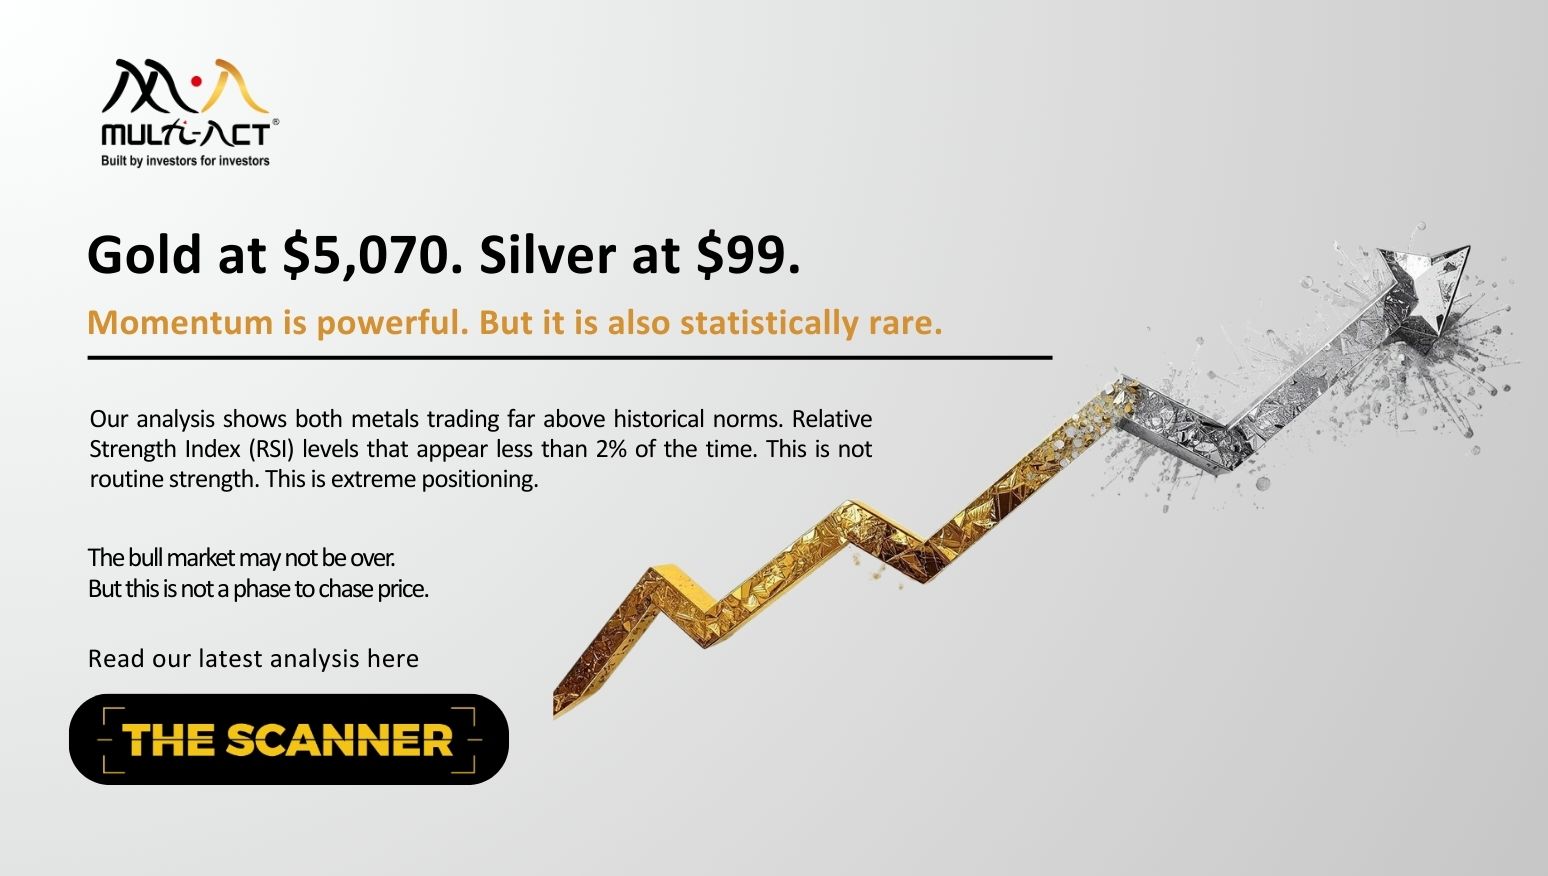
The Scanner, Jan’26 | Gold and Silver : Opportunity or overheating?
When prices rise very quickly, they often pause, or correct. In such moments, slowing down and staying … Continued
Read more31 December 2019

Reported financials have to follow accounting guidelines when they are presented to investors. However, while analyzing, it is important for an investor to make necessary adjustments to the reported numbers in order to make them relevant and understand the underlying economics of the business.
Below is case study of SBI Cards wherein we discuss how the accounting policies and changes therein impact the reported profits vis-a-vis economic profits of the business.
Credit card companies incur customer acquisition cost which comprise of:
a. Costs for acquiring customers through various channels and
b. Marketing cost – costs for advertisements and discounts or cashbacks offered. For SBI Cards, these cost mainly form part of “Advertisement and Sales promotions”. This has shown an increasing trend as % of total income over years.

Till 2014 – Amortized over a period of 12 months
Change in 2015 – Recognizing upfront – as and when incurred
Change in 2019 – Adopted Ind AS norms – Amortizing over the behavioral life of the customer


Given the nature of cost, this may be a recurring expense while the expected benefits may not be certain for the company. The company itself had been recognizing costs upfront before adopting Ind AS, probably an indication that this may be more practical way of looking at the profits of this business.
Thus, while the reported profits are in line with the prevalent accounting standards, an investor may want to use adjusted numbers to get closer to economic reality, before taking an investment decision.

When prices rise very quickly, they often pause, or correct. In such moments, slowing down and staying … Continued
Read more
2025 did not challenge growth. It challenged assumptions. As expectations moved ahead of actual delivery, prices adjusted … Continued
Read more
Macro numbers alone rarely tell the full story. When jobs, consumption, credit, and inflation are considered together, … Continued
Read moreReceive monthly updates by signing up to our newsletter.
| Sr. No. | Received from | Pending at the end of last month | Received | Resolved* | Total Pending # | Pending complaints > 3 months | Average Resolution time^ (in days) |
|---|---|---|---|---|---|---|---|
| 1 | Directly from Investors | 0 | 0 | 0 | 0 | 0 | 0 |
| 2 | SEBI (SCORES) | 0 | 0 | 0 | 0 | 0 | 0 |
| 3 | Other Sources (if any) | 0 | 0 | 0 | 0 | 0 | 0 |
| Grand Total | 0 | 0 | 0 | 0 | 0 | 0 | |
Number of complaints received during month against the IA due to impersonation by some other entity: Nil
Note: In case of any complaints received against the IA due to impersonation of the IA by some other entity, the IA may adjust the number of such complaints from total number of received/resolved complaints while preparing the above table. Further, IA must close such impersonation related complaints after following the due process as specified by SEBI/ IAASB.
* Inclusive of complaints of previous months resolved in the current month.
# Inclusive of complaints pending as on the last day of the month.
^ Average Resolution time is the sum total of time taken to resolve each complaint in days, in the current month divided by total number of complaints resolved in the current month.
| Sr. No. | Month | Carried forward from previous month | Received | Resolved* | Pending# |
|---|---|---|---|---|---|
| 1 | April, 2025 | 0 | 0 | 0 | 0 |
| 2 | May, 2025 | 0 | 0 | 0 | 0 |
| 3 | June, 2025 | 0 | 0 | 0 | 0 |
| 4 | July, 2025 | 0 | 0 | 0 | 0 |
| 5 | August, 2025 | 0 | 0 | 0 | 0 |
| 6 | September, 2025 | 0 | 0 | 0 | 0 |
| 7 | October, 2025 | 0 | 0 | 0 | 0 |
| 8 | November, 2025 | 0 | 0 | 0 | 0 |
| 9 | December, 2025 | 0 | 0 | 0 | 0 |
| Grand Total | 0 | 0 | 0 | 0 | |
* Inclusive of complaints of previous months resolved in the current month.
# Inclusive of complaints pending as on the last day of the month.
| SN | Year | Carried forward from previous year | Received | Resolved* | Pending# |
|---|---|---|---|---|---|
| 1 | 2021-22 | 0 | 0 | 0 | 0 |
| 2 | 2022-23 | 0 | 0 | 0 | 0 |
| 3 | 2023-24 | 0 | 0 | 0 | 0 |
| 4 | 2024-25 | 0 | 0 | 0 | 0 |
| Grand Total | 0 | 0 | 0 | 0 | |
* Inclusive of complaints of previous years resolved in the current year.
# Inclusive of complaints pending as on the last day of the year.