Assessing the effectiveness of mutual fund categories in Indian portfolios
Amogh Korde, Project Lead – Behavioural and Fund Analytics at Multi-Act, delves into the ever-evolving investment landscape … Continued
Read more8 April 2019

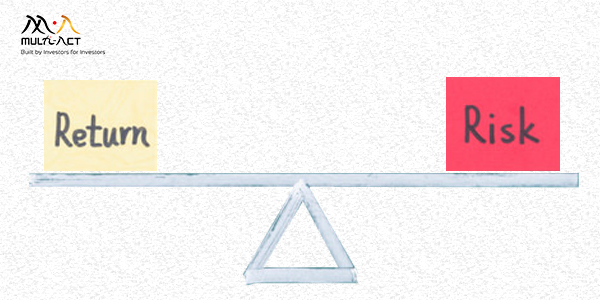
While evaluating performance, a lot of attention is given to returns while ignoring the risk taken to achieve the returns. Investors have limited control over the quantum of returns they can generate. But certainly, they have more control over how much risk they are willing to take. It is commonly believed that by taking higher risk you would generate higher returns. But investors are not “entitled” to higher returns just because they take higher risks.
Howard Marks, in his memos and his book “The Most Important Thing” had discussed the above point through a very intuitive graph. While general financial theory talks about the “Risk vs. Return” relationship from a linear perspective as indicated in the chart below, Marks suggests a different graphical description as shown in Chart 2. Chart 1 implies that to make higher returns, you must take higher risks.
He advises us instead though, that “If riskier investments could be counted on to produce higher returns, they wouldn’t be riskier”. In short taking higher risks does not guarantee higher returns.

Instead of Chart 1 (above), Howard Marks suggested the following relation between Return and Risk in Chart 2 below.

There is a range of possible outcomes when you look at an investment. The variability of the possible outcomes is the risk. While the expected returns rise with risk, so does the probability of lower returns, including loss.
“Risk means more things can happen than will happen.” – Elroy Dimson
Howard Marks frequently refers to the above quote which captures the true essence of risk. Investors must deal with uncertainty and a set of outcomes that could have different probabilities of playing out. While looking at a return/performance, you need to keep in mind that the performance that you are seeing is only one of the probable sets of outcomes that could have taken place.
The chart below captures the performance of 469 Mutual Funds (MFs) (Debt, Hybrid and diversified Equity) for the last 5 years along with Risk (Annualised Standard Deviation). The chart shows that variability of performance in Debt MFs is lower as compared to Hybrid MFs and significantly lower when compared to Equity. The red line is the line of best fit (Regression line). The MFs that are above the red line have provided superior risk-adjusted returns. While the ones below have not compensated for the risk taken.

Source: ACE MF
While we don’t consider standard deviation of returns as risk, to showcase how a negative scenario could affect performance outcome, we have used Standard Deviation.
But the performance that we see for MFs is again only one of the multiple probable sets of outcomes that could have transpired. The question is, how would the chart have looked if a negative market environment had prevailed. In the following chart, we have adjusted the Return numbers by one standard deviation downwards. In the negative outcome, the investor in equity would have experienced returns equal to or even lower than Debt MFs.

Risk-adjusted ReturnsAs an investor, therefore, it is important to introspect as to whether such a negative outcome would allow you to stick to your financial plan and asset allocation.
Evaluating risk-adjusted returns in Equity as an asset class is crucial as the variability of returns is the highest. And while it would be good to anticipate the upside, the focus needs to be on how badly you could be hurt on the downside and whether you would be able to endure the pain.
The biggest mistake is not knowing your risk tolerance while investing and then being forced to reduce exposure to Equities when the true risk tolerance limit is hit. Investors should try to identify those funds that historically have provided good returns while being more efficient
when it comes to the risk undertaken. Such funds usually, while providing the upside when positive outcomes prevail, would also protect you and relatively outperform when negative outcomes prevail.
This allows you to remain longer in the Equity asset class and get the best out of it in terms of expected returns while also allowing you to sleep well at night.
At Multi-Act, we focus a lot on risk. Our investment process tries to identify opportunities that could provide disproportionate gains for a given level of risk (downside). By consistently identifying such investments and being willing to sit on cash when such opportunities are not
available, allows us to build portfolios that could provide superior risk-adjusted returns in the long run.
If you would like us to evaluate Mutual Funds or your Portfolios from the above Return vs Risk perspective and if you wish to understand more about our investment process, please get in touch with us.

Amogh Korde, Project Lead – Behavioural and Fund Analytics at Multi-Act, delves into the ever-evolving investment landscape … Continued
Read more
When I consider PSU stocks, I’m reminded of the famous song of Bob Dylan, “The Times They … Continued
Read more
The Indian economy is on a promising trajectory, with expectations of robust GDP growth surpassing 6.5% in … Continued
Read moreReceive monthly updates by signing up to our newsletter.
| Sr. No. | Received from | Pending at the end of last month | Received | Resolved* | Total Pending # | Pending complaints > 3 months | Average Resolution time^ (in days) |
|---|---|---|---|---|---|---|---|
| 1 | Directly from Investors | 0 | 0 | 0 | 0 | 0 | 0 |
| 2 | SEBI (SCORES) | 0 | 0 | 0 | 0 | 0 | 0 |
| 3 | Other Sources (if any) |
0 | 0 | 0 | 0 | 0 | 0 |
| Grand Total | 0 | 0 | 0 | 0 | 0 | 0 |
Trend of Monthly Disposal of Complaints
| Sr. No. | Month | Carried forward from previous month | Received | Resolved* | Pending# |
|---|---|---|---|---|---|
| 1 | April 2023 | 0 | 0 | 0 | 0 |
| 2 | May 2023 | 0 | 0 | 0 | 0 |
| 3 | June 2023 | 0 | 0 | 0 | 0 |
| 4 | July 2023 | 0 | 0 | 0 | 0 |
| 5 | August 2023 | 0 | 0 | 0 | 0 |
| 6 | September 2023 | 0 | 0 | 0 | 0 |
| 7 | October 2023 | 0 | 0 | 0 | 0 |
| 8 | November 2023 | 0 | 0 | 0 | 0 |
| 9 | December 2023 | 0 | 0 | 0 | 0 |
| 10 | January 2024 | 0 | 0 | 0 | 0 |
| 10 | February 2024 | 0 | 0 | 0 | 0 |
| 11 | March 2024 | 0 | 0 | 0 | 0 |
Grand Total |
0 |
0 |
0 |
0 |
Trend of Annual Disposal of Complaints
| Sr. No. | Year | Carried forward from previous year | Received | Resolved* | Pending# |
|---|---|---|---|---|---|
| 1 | 2019-20 | 0 | 0 | 0 | 0 |
| 2 | 2020-21 | 0 | 0 | 0 | 0 |
| 3 | 2021-22 | 0 | 0 | 0 | 0 |
| 4 | 2022-23 | 0 | 0 | 0 | 0 |
| Grand Total | 0 | 0 | 0 | 0 |